Chief Curiosity Officer.

I’ve always been obsessed with the patterns that others miss. I founded Third Variable because I saw a recurring problem: organizations are often data-rich but insight-poor. They see the correlation, but they miss the underlying drivers.
I have 15 years of experience as a researcher, data scientist and impact specialist, and nurtured my curiosity through degrees at the Universities of Oxford and Cambridge in environmental science, urban data science and health economics. I hold a PhD in environmental computation.
My career has been built on delving deep into numbers (using statistics, modelling, GIS and machine learning) and pairing them with human-centred design and empathetic stakeholder engagement.
As a recovering academic, I’ve studied some whacky things, which fall into three broad themes: nature, people and cities.
Research expertise

-
How rock breaks down on coastlines and on Mars
How water flows beneath ice sheets
How gravestones record climate change

-
How information spreads among homeless people
How mining affects nomadic communities
How walkability affects health outcomes
How transportation changes suburbs and loneliness

-
How cities are hardwired to be unequal
How transit can be more convenient
How to expose unequal access to jobs, healthcare, green space and water
How electric vehicles interact with homes
A winding path
My education and career has meandered – just like the glacial rivers I studied on the Greenland Ice Sheet.
-
PhD, Environmental Science
University of Oxford
deserts /// climate change /// africaMasters, Polar Studies
University of Cambridge
glaciers /// ice sheets /// greenlandBA, Geography
University of Oxford
landscapes /// inequality /// development -
Consultant
Third Variable
impact /// strategy /// advisoryDirector of Research & Consulting
Spare
data /// leadership /// productPostdoctoral Researcher
University of British Columbia
urban /// inequality /// researchTutor & Honorary Fellow
University of Oxford
teaching /// mentoring /// creativityTour Manager and Trainer
AIFS
educating /// travelling /// laughingConsultant
Sancroft
sustainability /// ethics /// businessResearcher
Channel 4, BBC
documentaries /// interviews /// research -
Honorary Research Fellow
University of Exeter
health /// communities /// physical activityPostdoctoral Research Fellow
University of British Columbia
cities /// data science /// epidemiologyVisiting Scholar, Artificial Intelligence
University of Southern California
ai /// social networks /// conservationPostgraduate Fellow
UK Parliament
communication /// politics /// waterCollege Lecturer and Tutor
University of Oxford
teaching /// mentoring /// learning -
Director
Draft & Flow Cycle Workshop
cycling /// funding /// community
Board Member
Just Wheels
disability /// mobility /// educationScientific Advisor
Polar Academy
expeditions /// inspiration /// resilienceAdvisor
IONA Drones
drones /// delivery /// equityImpact Strategist
Aban Outdoor Adventure
youth /// learning /// natureBoard Member
Elektra Women's Choir
music /// art /// technologyHomeless Shelter Advisory Committee
Streetohome
addiction /// homelessness /// hope

Why ‘Third Variable’?
Also known as a ‘confounding’ or ‘lurking’ variable, a third variable refers to an unmeasured effect that influences both the supposed cause and effect of a phenomenon.
Throughout my career and personal life, I have come to understand the importance of gathering a holistic picture of what’s going on, before making a change. This applies as much to government policies as it does to natural environments and human beings.
When setting up Third Variable, I felt it appropriate to acknowledge the ‘missing links’ that often go unseen in data. It’s a constant reminder to account for them in my work.
Fun fact: Third Variable’s logo is composed of a mirrored epsilon symbol (ε) and an inverted lambda symbol (𝜆). In science, epsilon typically refers to something small or negligible, and lambda commonly represents wavelength. Together, they symbolise a search to “get on the wavelength” of neglected data.
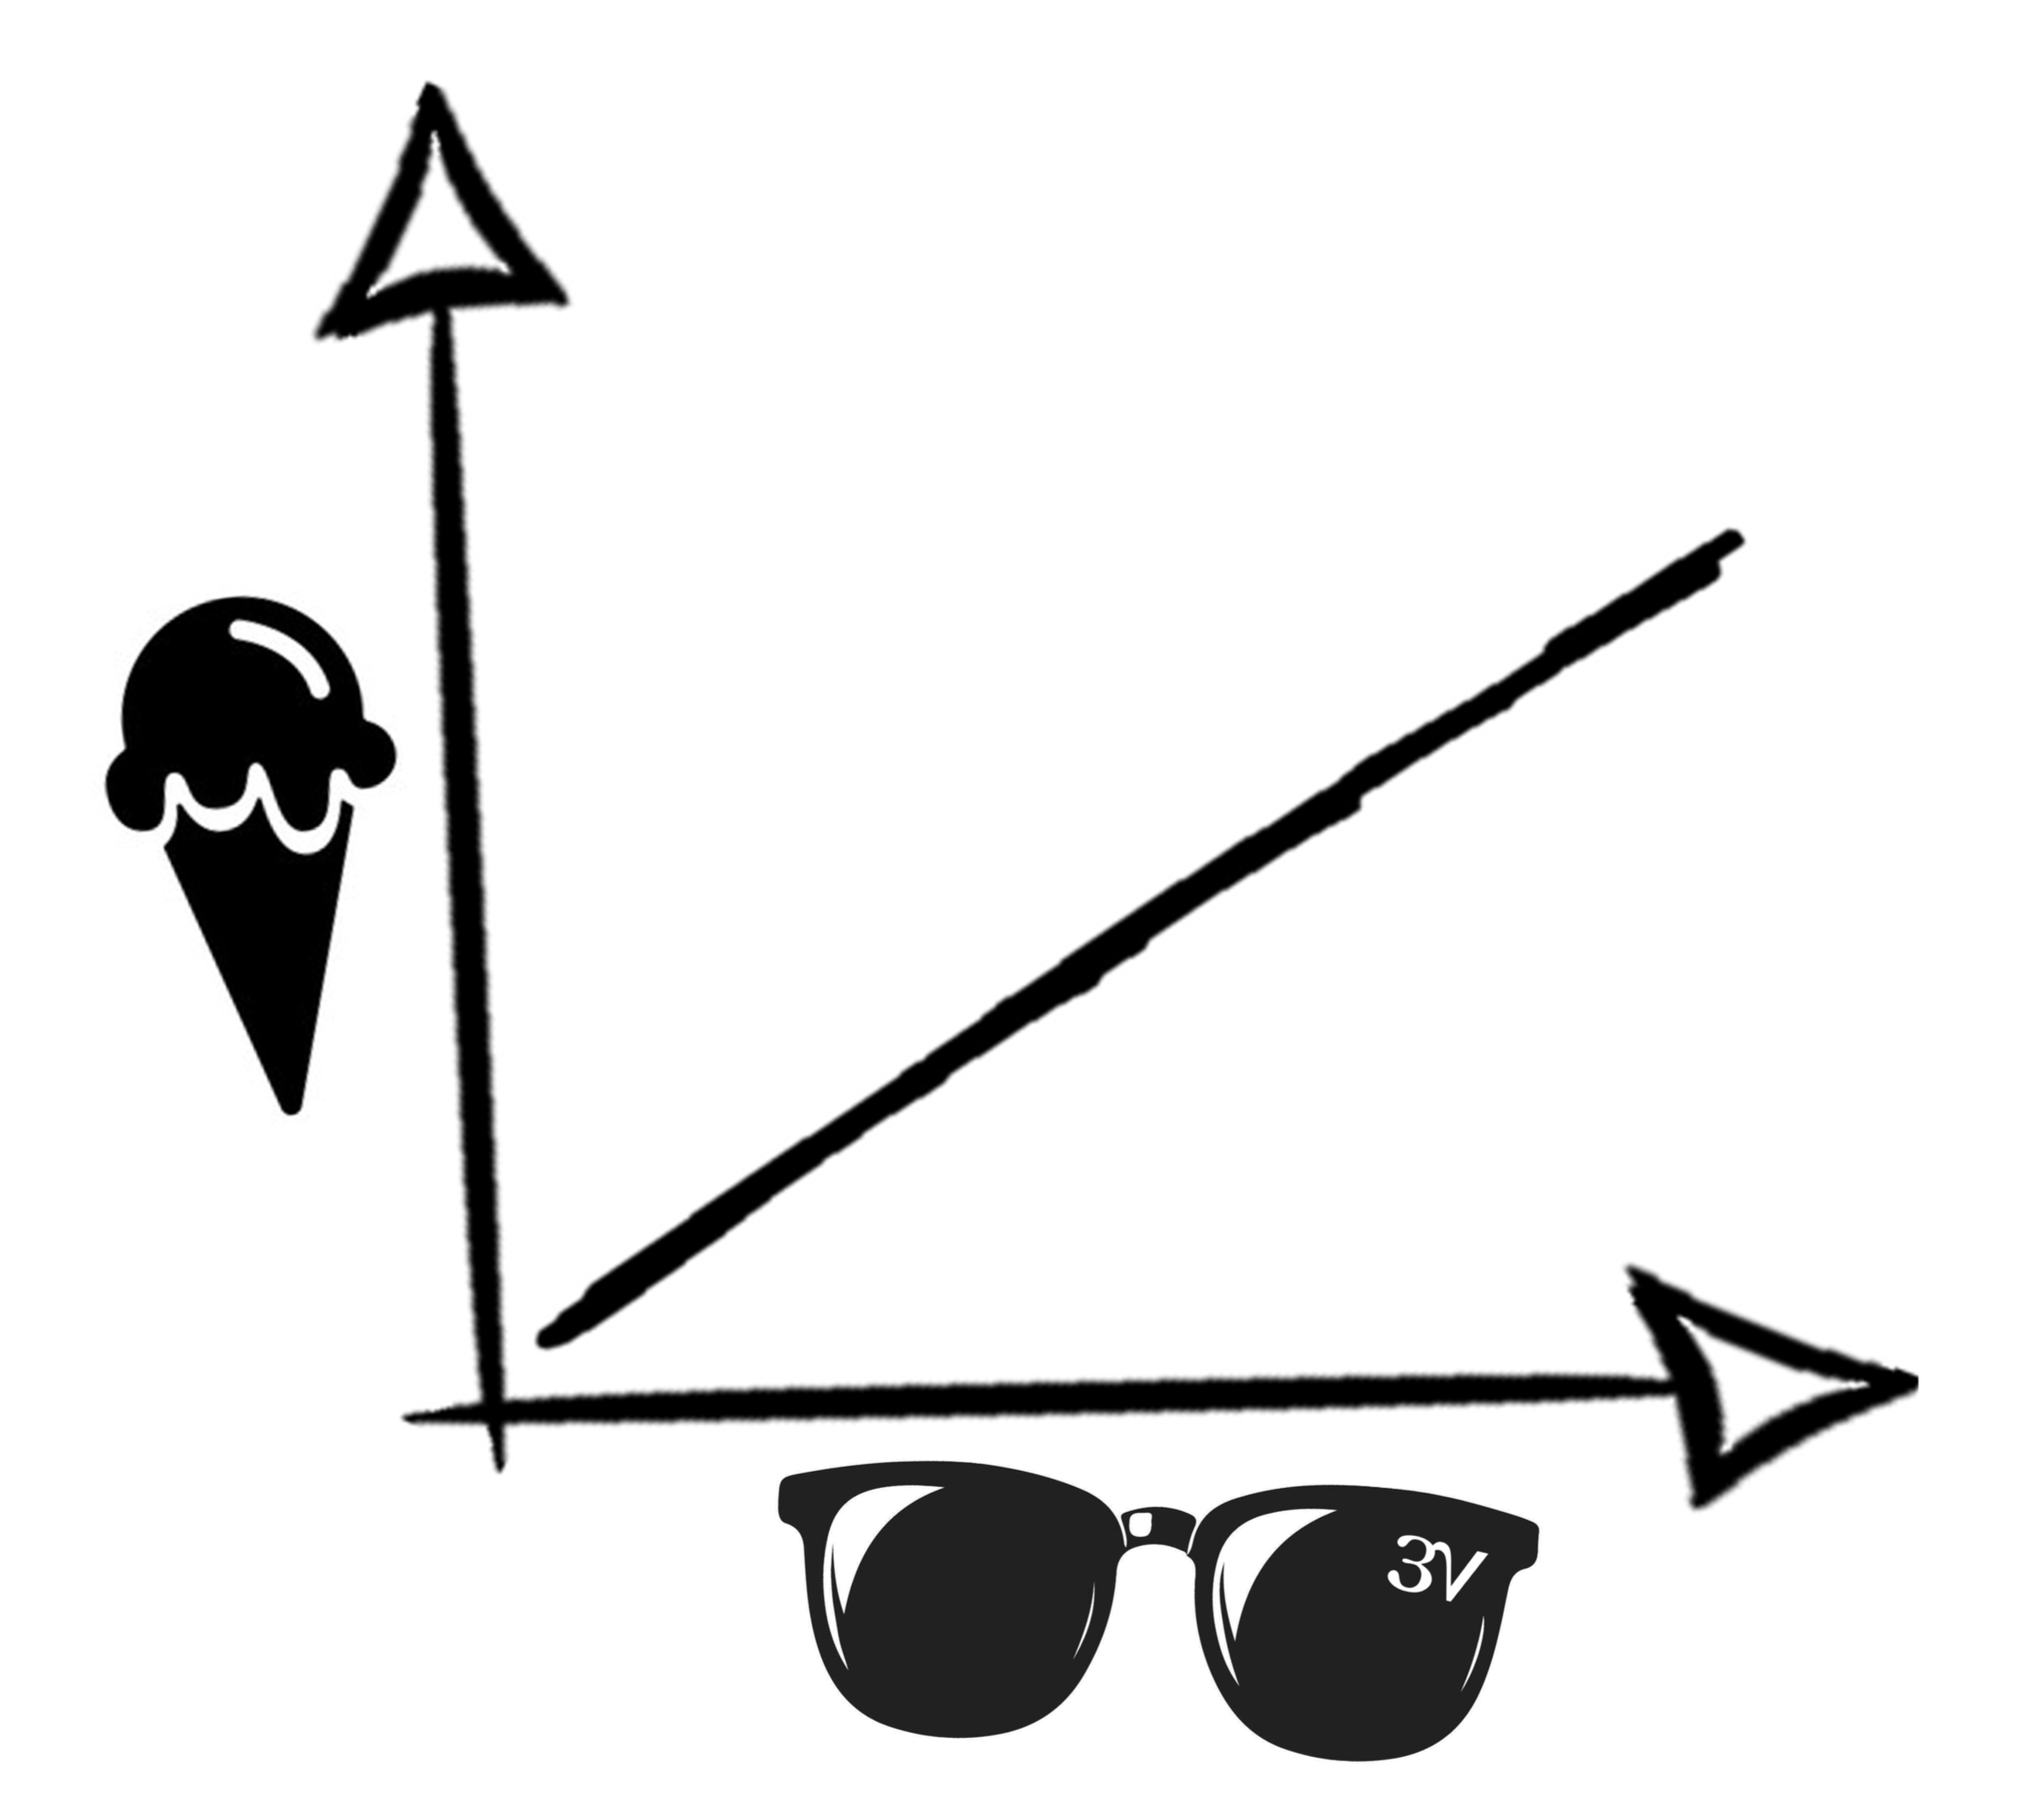
As sales of sunglasses go up, so do sales of ice-creams. Does this mean one causes the other? No! A lurking variable, sunshine, controls the relationship between the two.
Spreading
the nerd
I am interested in the ways research can be communicated to policymakers, decision-makers and the general public.
I abide by the mantra, “know your audience”, and try to always tailor my messaging to whoever is listening.
My efforts range from blogging on Medium, to writing briefings for parliamentarians and producing podcasts and documentaries.
I also give talks about science and policy at universities, non-profits and schools.