
Case Study
Collin County Transit
Econometric analysis to propose fare changes to Collin County Transit's subsidised demand-responsive service.
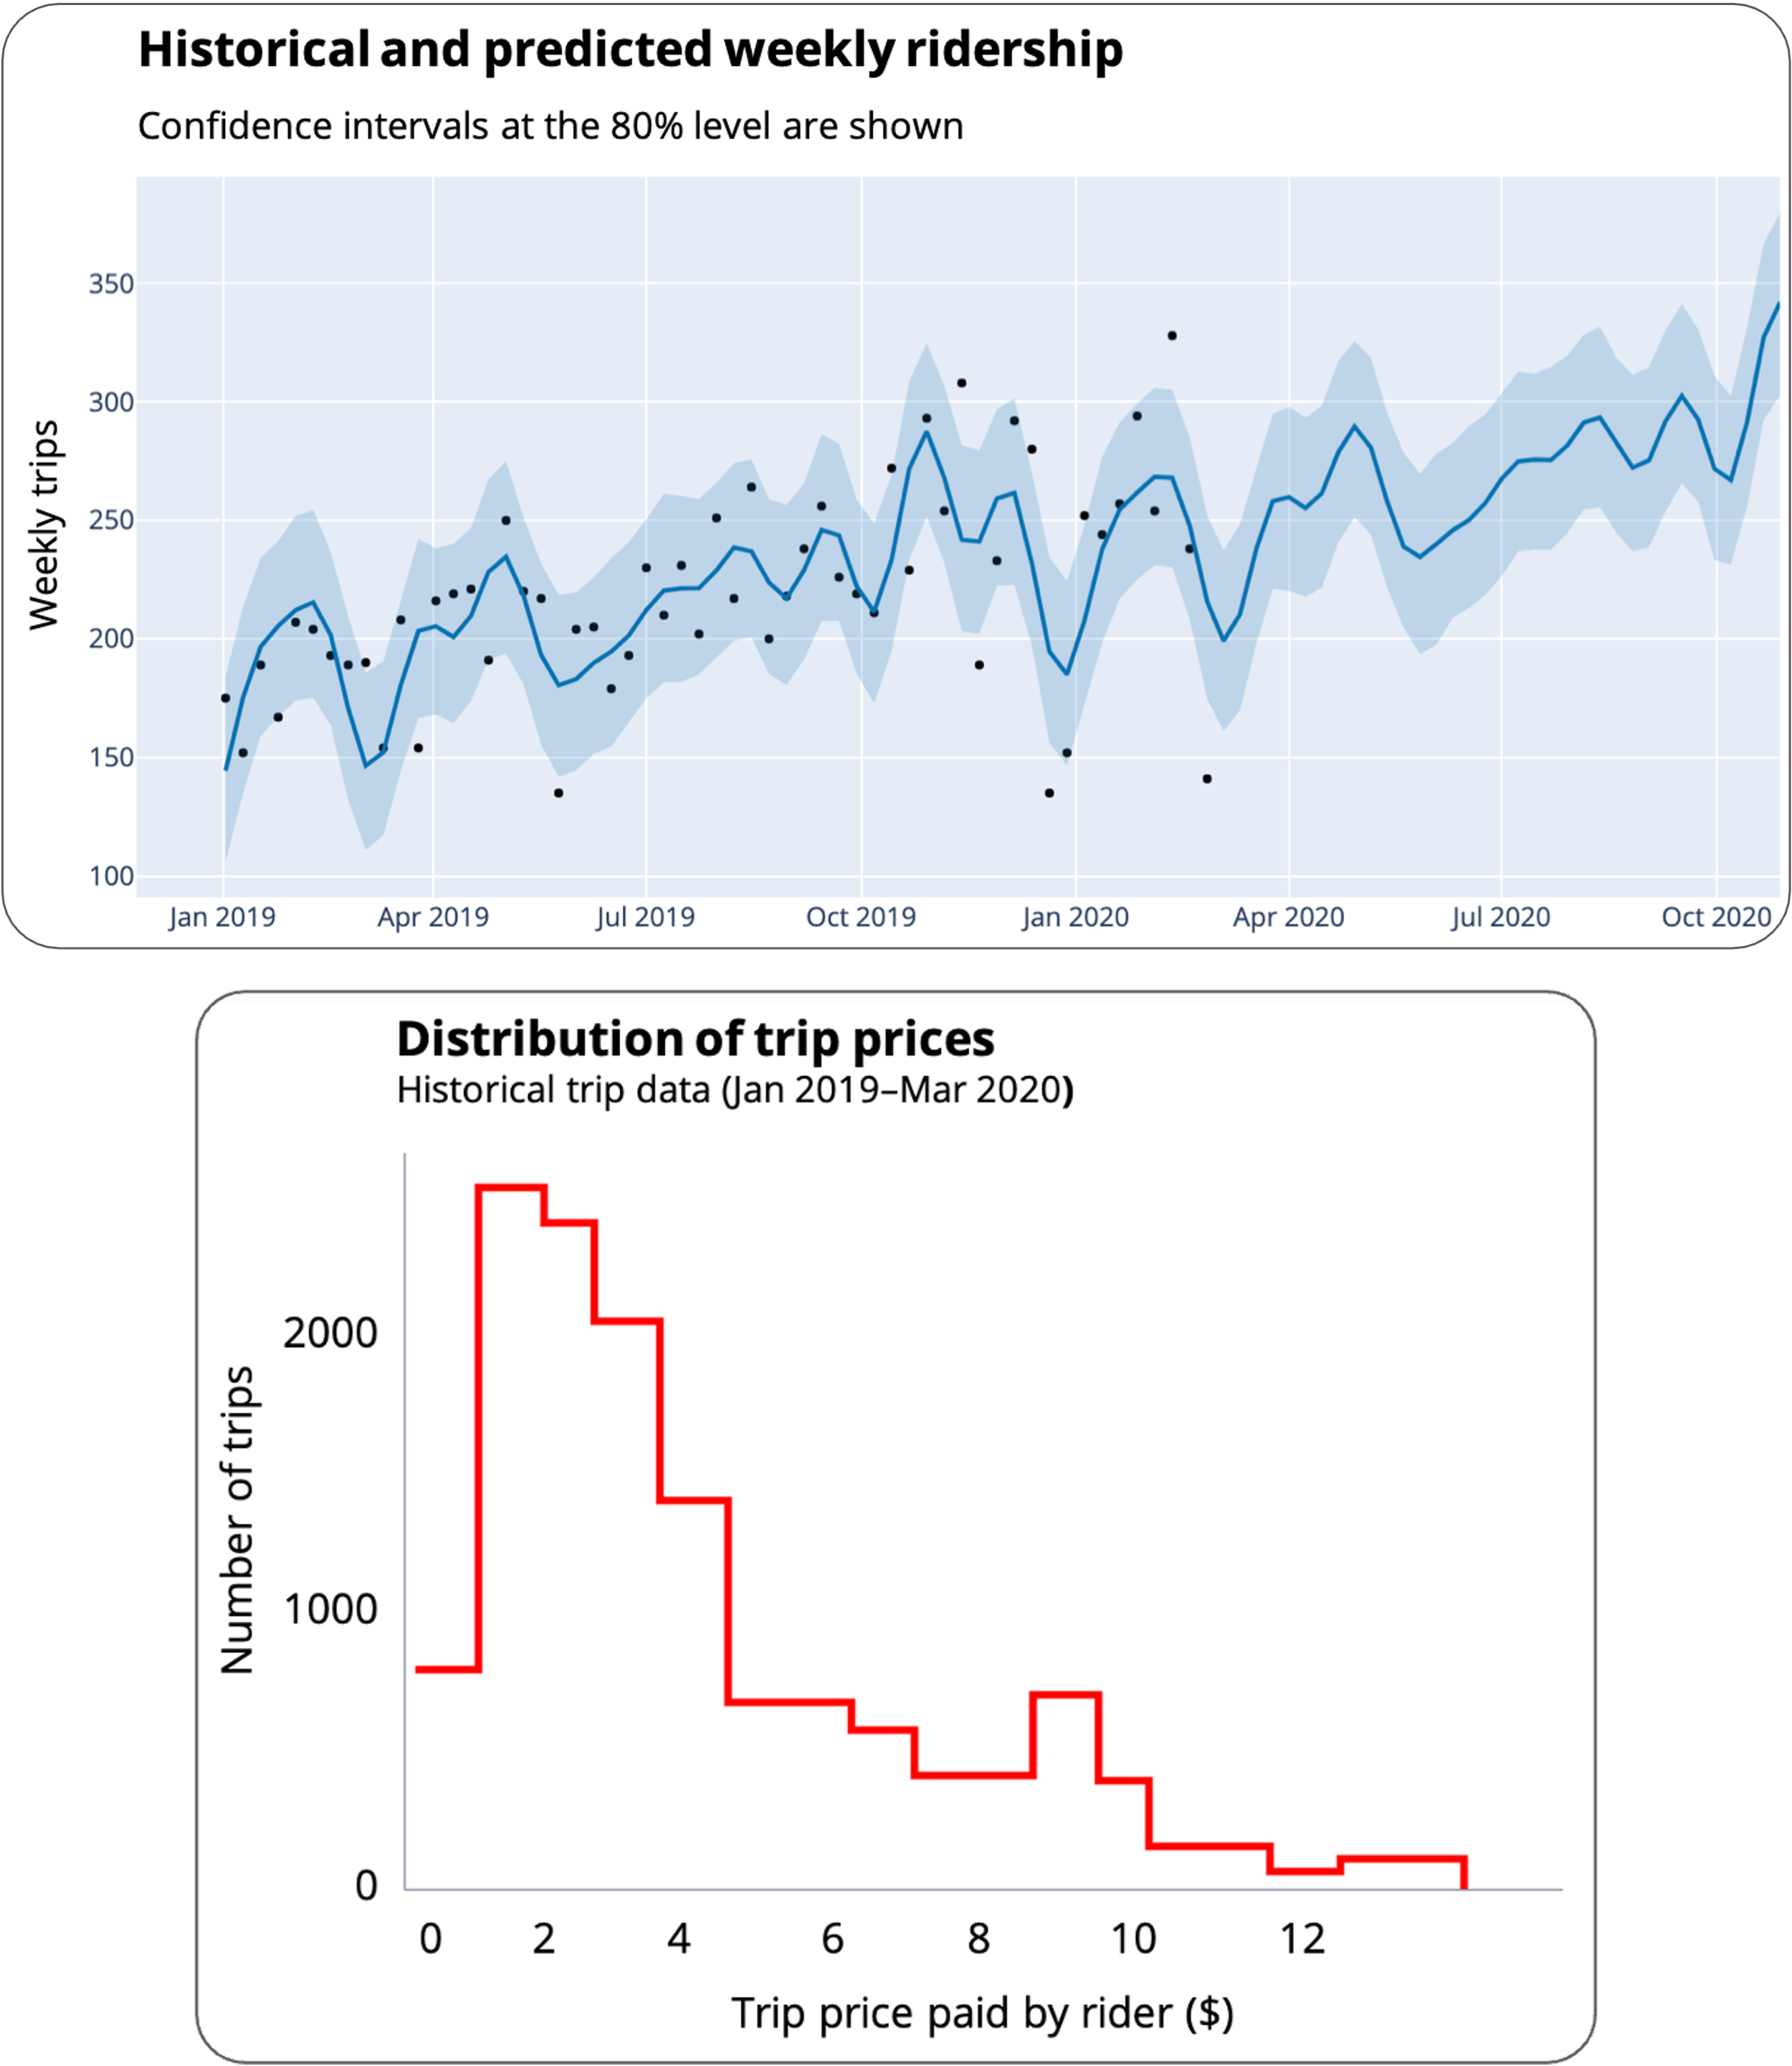
This project, led by Jerome in his capacity as Director of Research & Consulting at Spare, aimed to forecast changes in Collin County Transit's (CCT) ridership following the implementation of a new flat-fare pricing structure. The financial model accounted for both underlying ridership growth/decline and the expected behaviour change in response to fare adjustments. The core method involved calculating price elasticity—the sensitivity of ridership to fare changes—based on historical trip data.

The primary goals of the project were to:
Forecast ridership: Accurately predict the total volume and distribution of ridership after the new flat fare is introduced.
Determine price sensitivity: Apply appropriate elasticity analysis to estimate how much ridership would increase (for trips that become cheaper) or decrease (for trips that become more expensive).
Project goals
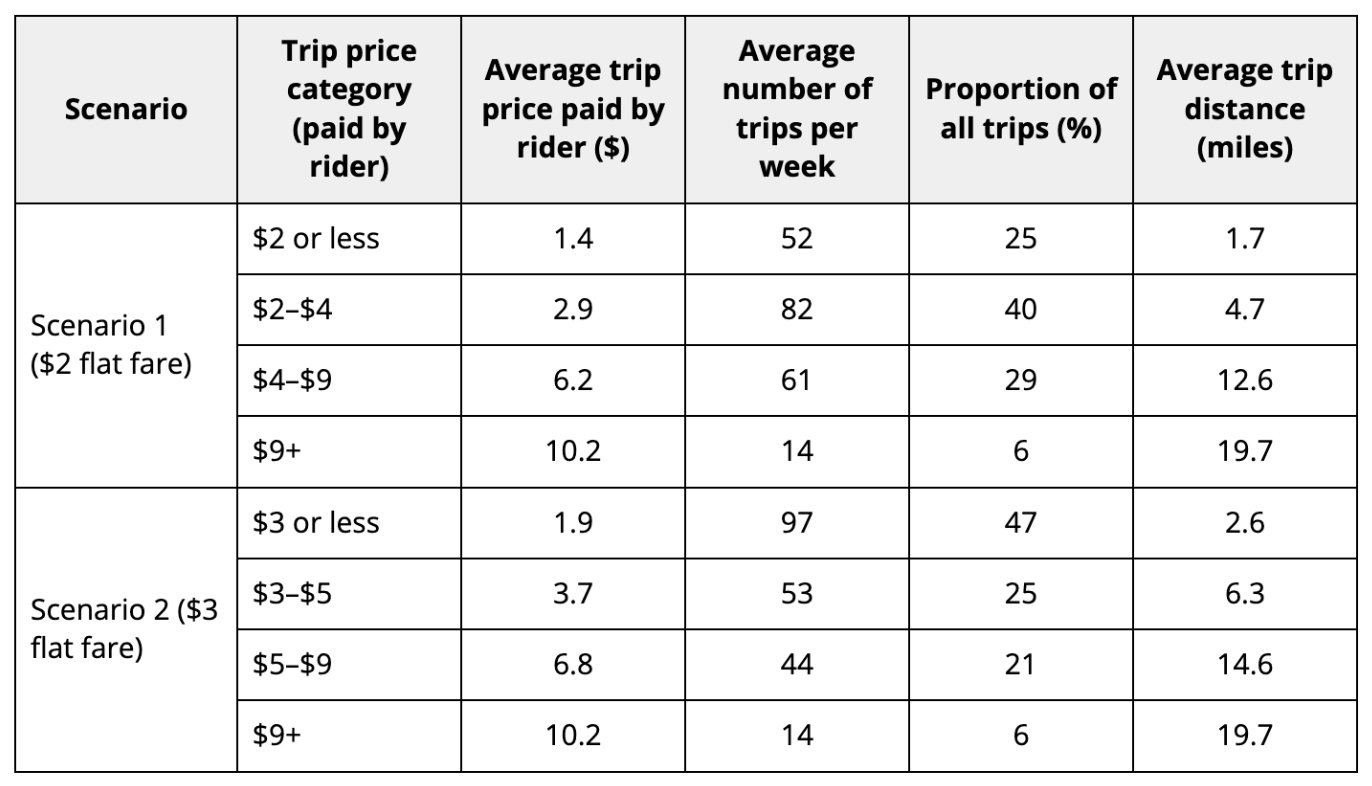
Historical trip data was categorized into price bands to analyze trips that would experience "low gains," "medium gains," or "big gains" (i.e., cost reductions), or "more cost" under the new structure. We assumed price change elasticity was asymmetric – i.e. price reductions (trips that become cheaper) have less of an impact on increasing ridership than equivalent price increases would have on decreasing ridership. This reflects loss aversion theory from behavioural psychology.
Approach
Pricing Scenarios: Two scenarios were modelled: a $2 flat fare and a $3 flat fare.
The $3 flat fare wins: We found that under the $3 flat-fare scenario, 52% of historical trips would experience a decrease in price (i.e. gain to the rider), with 47% of all trips costing the rider $3 or less.
Key results
CCT adopted our proposed fare structure of a flat $3 fee, to the benefit of the majority of its riders.
The projected change in ridership volume from this analysis was integrated as a key input into subsequent simulations to model the operational performance of a new demand-responsive service in CCT. Our forecasting was crucial for making informed decisions regarding vehicle procurement and resource allocation for the service launch.