
Case Study
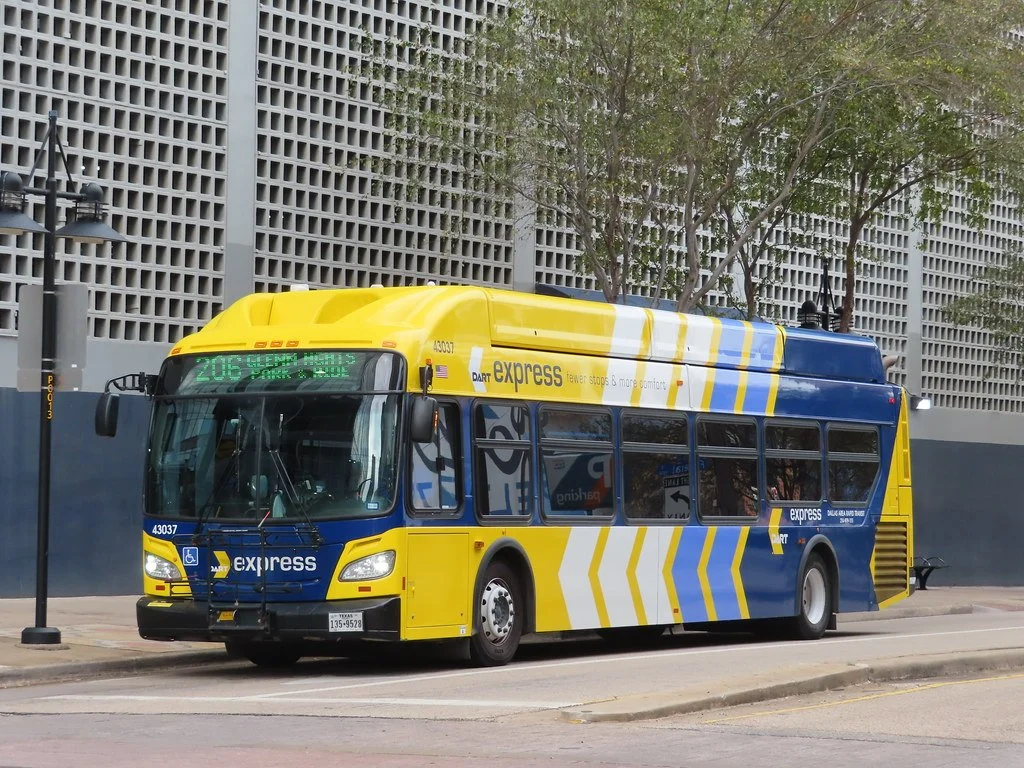
Dallas Area Rapid Transit
Reverse-engineering bus routes using a massive microtransit ridership dataset in Dallas.
We analyzed over 100,000 trips from Dallas Area Rapid Transit’s (DART) ‘GoLink’ microtransit service, to illustrate how microtransit data can be used to reverse-engineer and optimize fixed-route transit networks.
This research was published in a peer-reviewed journal, as an open-source methodology that can be replicated in other cities.
The primary goals of the project were to:
Reverse-engineer transit route: Use high-resolution microtransit data to inform the optimal design of fixed-route bus lines and stops.
Address ‘transit deserts: Identify areas where traditional fixed-route services are insufficient and provide a more efficient and convenient ’first mile-last mile’ solution.
Improve operational efficiency: Analyse the impact of microtransit on wider transit ridership and reduce overall agency costs for DART.
Project goals
GoLink is North America's largest microtransit system, covering 14 zones home to 830,000 residents. Our study specifically focused on four distinct zones in the Dallas region – Legacy/Plano, Inland Port, Rowlett, and North Dallas.
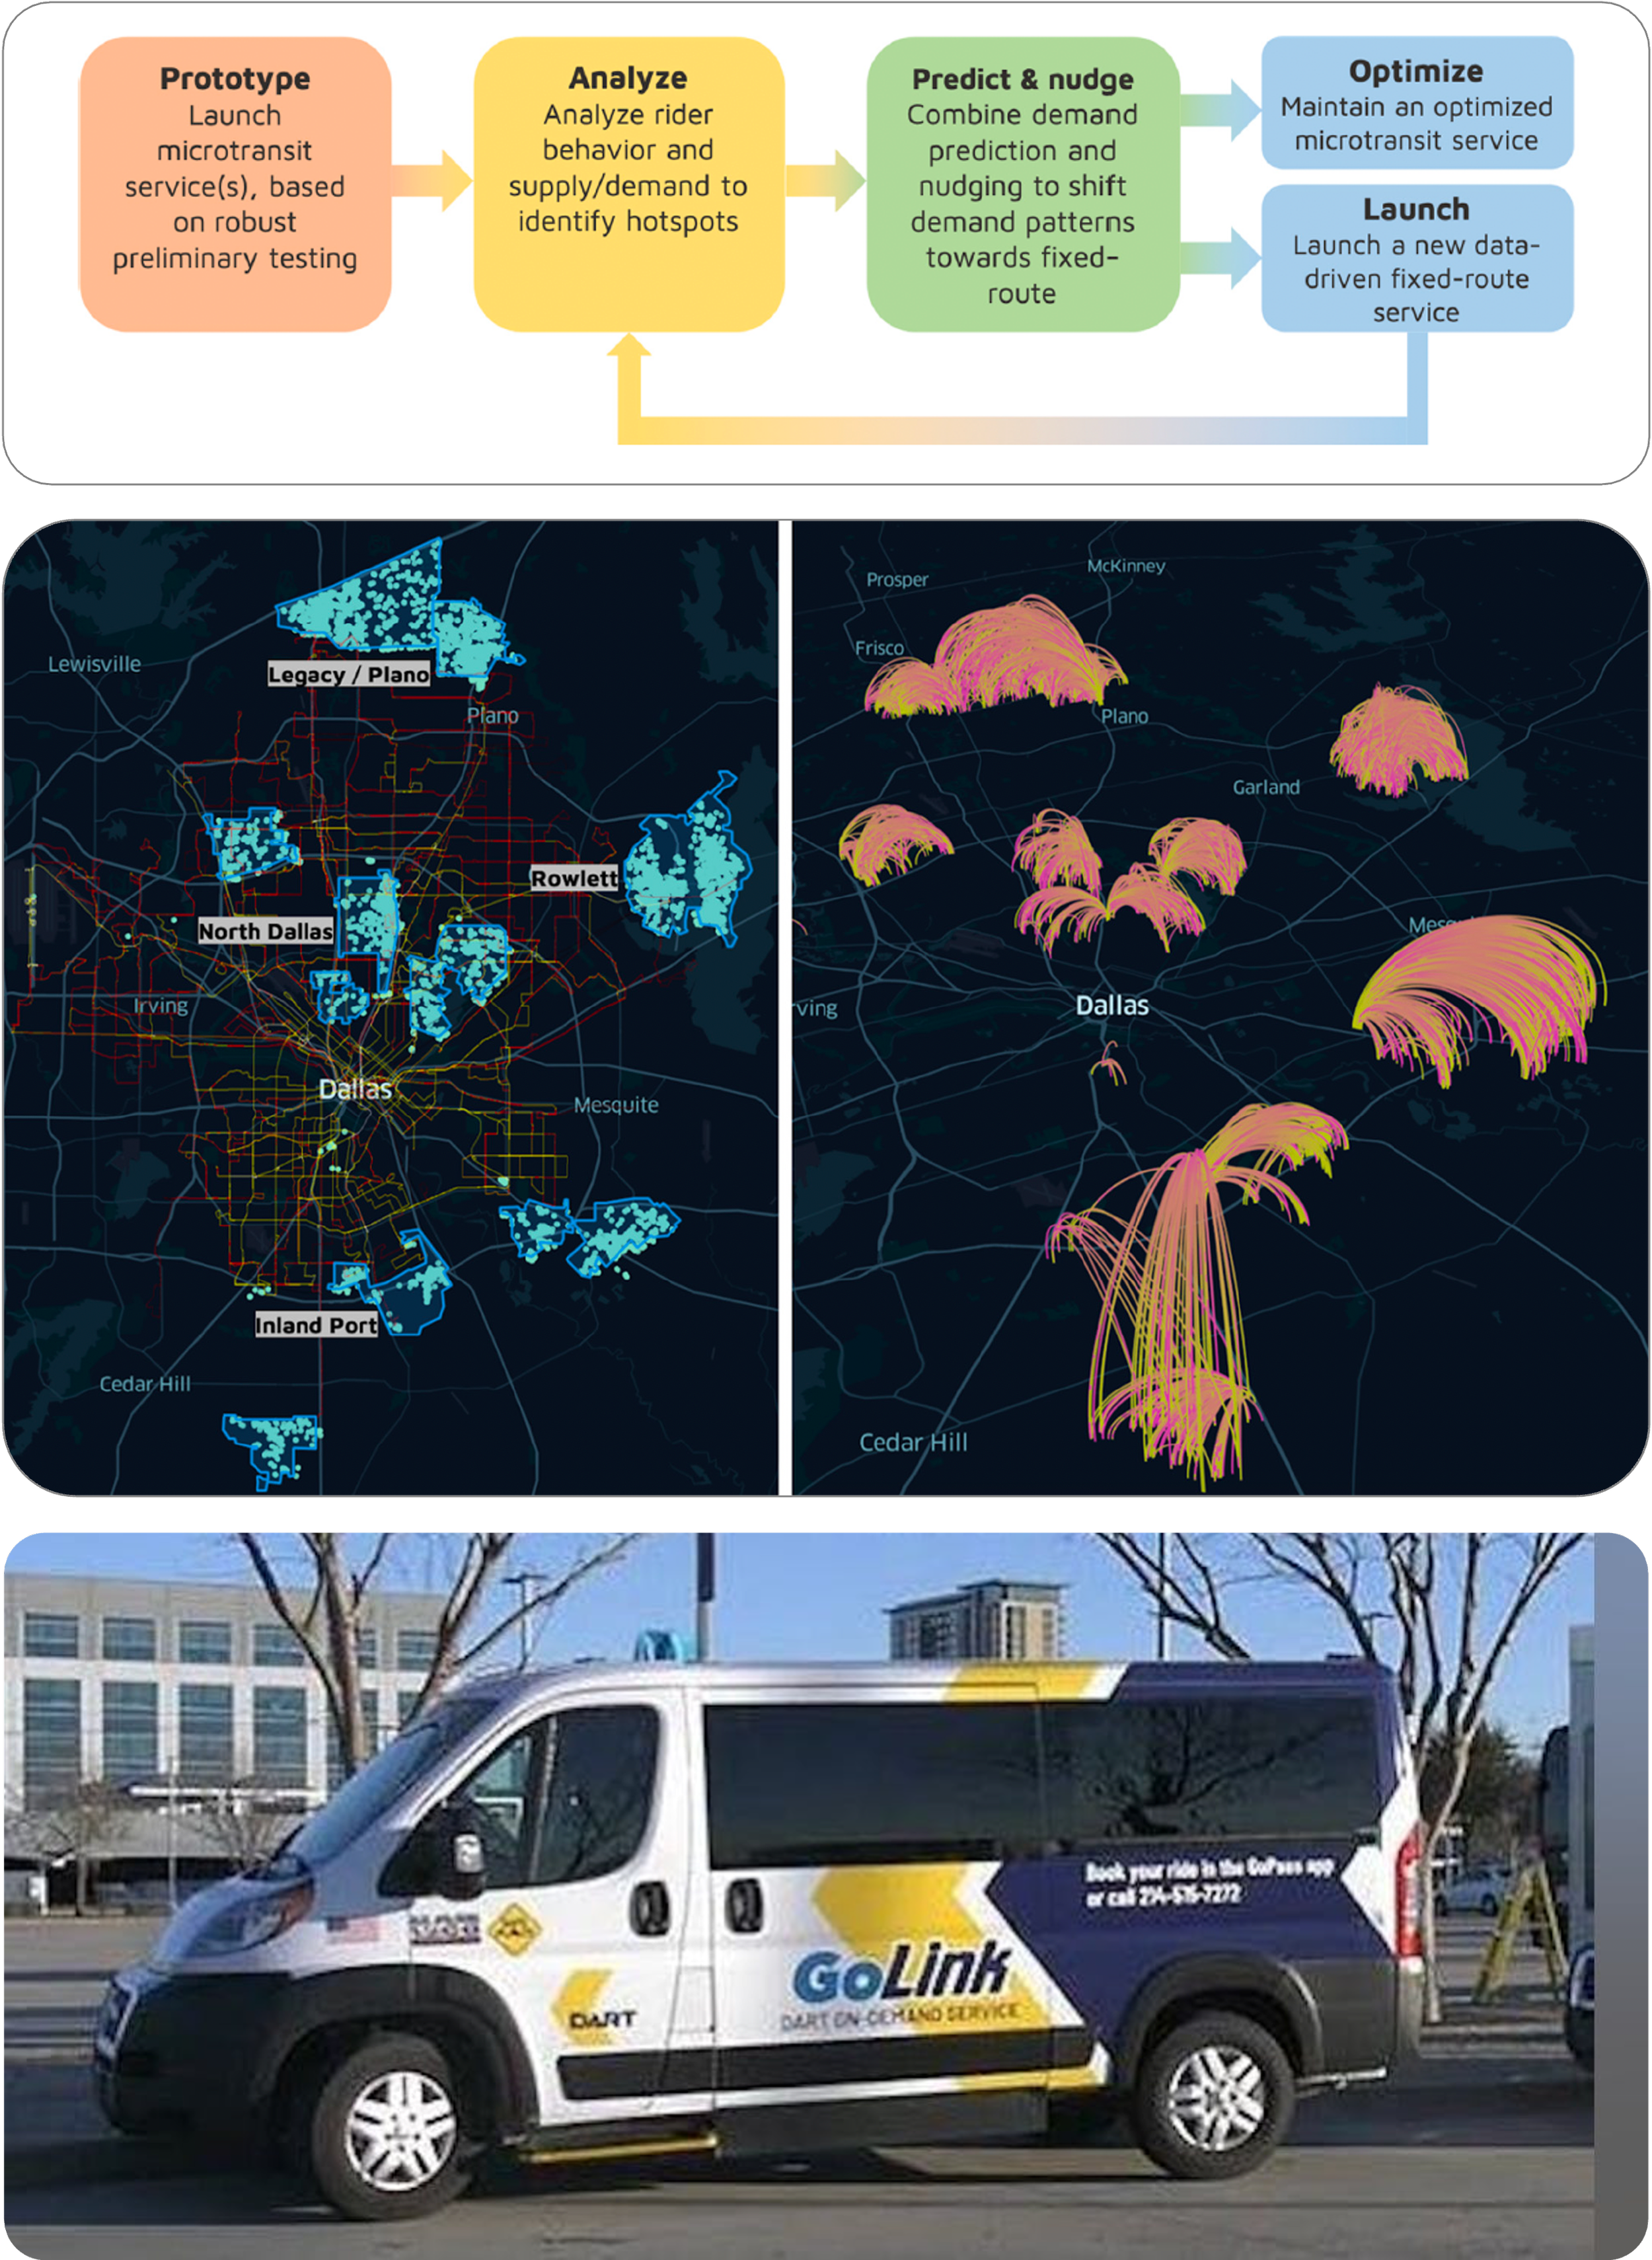
We combined unsupervised machine learning with traditional planning expertise to ‘flip transit on its head’:
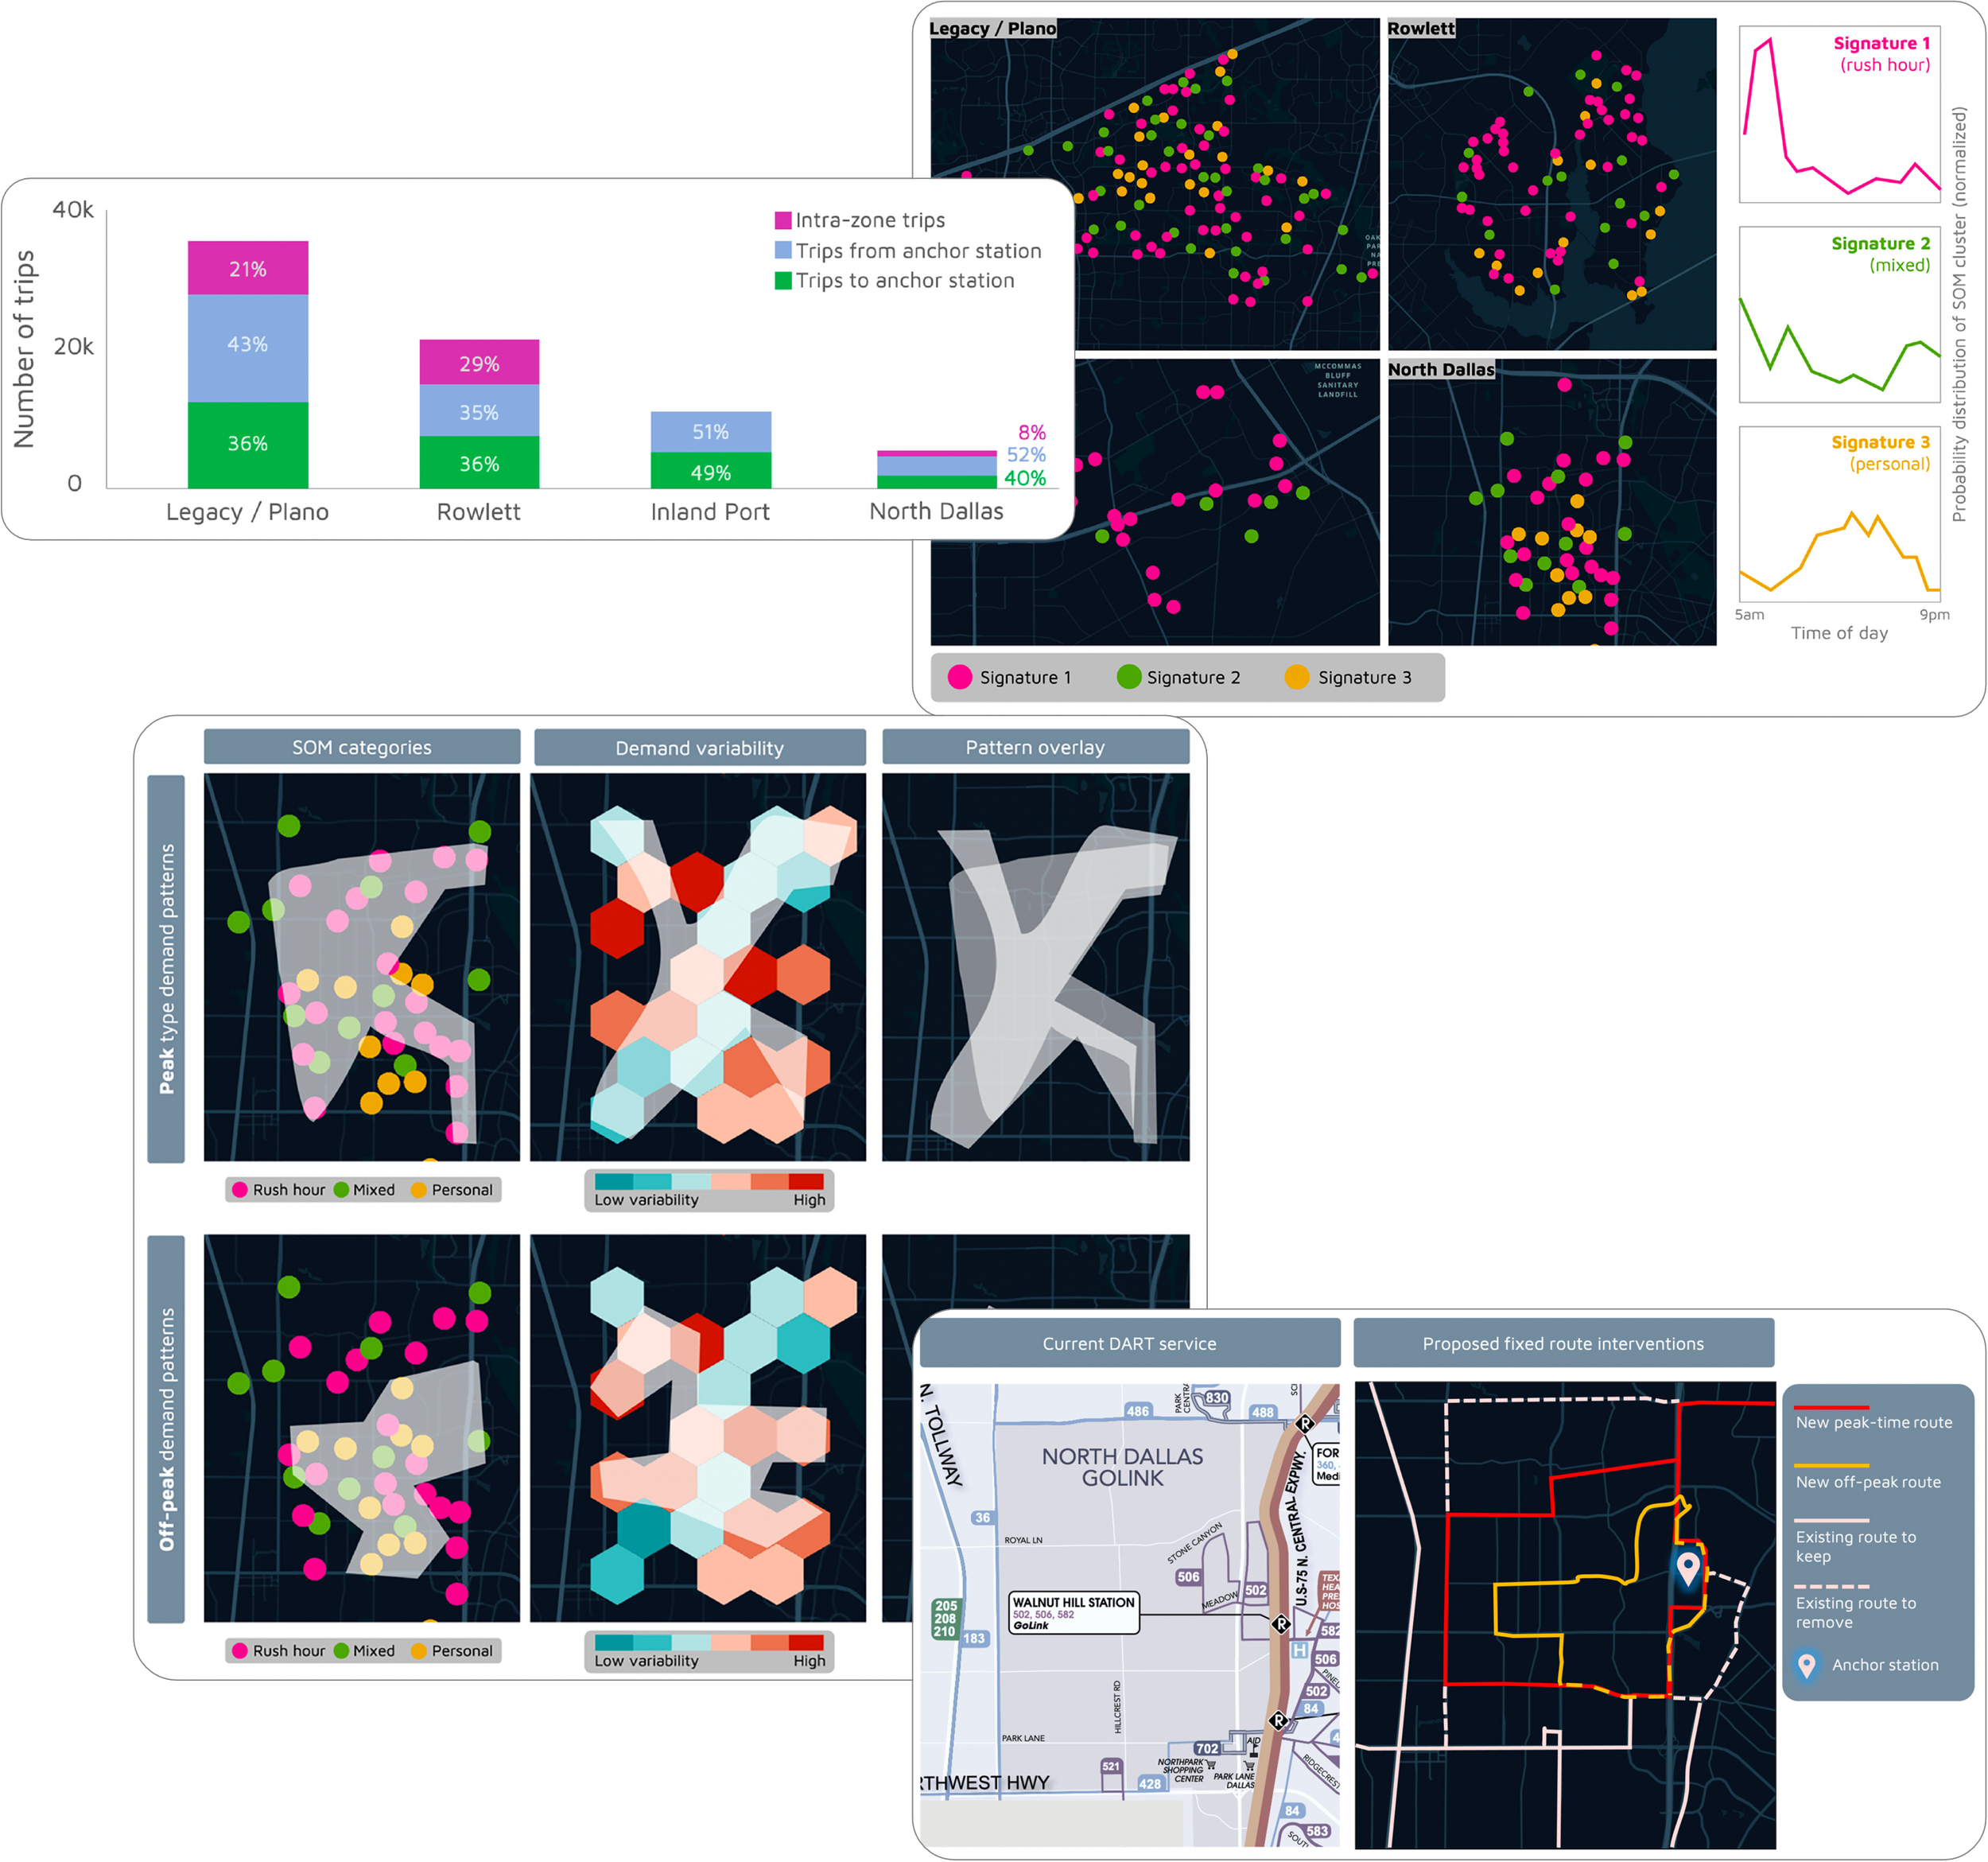
Spatial clustering: We used the DBSCAN algorithm to group trip origin data into ~500 spatial clusters, to identify high-density demand hotspots.
Time signature analysis: We then used self-organizing maps to categorise the spatial clusters into three time signatures: rush hour (morning peaks), mixed (peak and midday), and personal (midday peaks).
Route recommendations: Finally, we overlaid microtransit demand locations onto existing fixed-route lines to map supply-demand mismatches and visualize temporal demand variability using standard deviation. This formed the basis for re-routing recommendations.
Approach
Strong rider loyalty: GoLink maintains a monthly average of 17,800 boardings, with regular users taking an average of eight trips per month.
Multiplier effect on rail transit: Most GoLink trips (71%–99%, depending on zone) were ’transit-connecting’, leading to statistically significant ridership increases at anchor stations like UNT and Northwest Plano Park & Ride.
Closing the gap in coverage: The data revealed ‘transit deserts’ where riders previously faced up to a two-hour walk to the nearest bus stop.
Cost and efficiency gains: Since partnering with software providers, DART’s microtransit operational costs decreased by 26%, while efficiency (riders per revenue hour) grew by 14%.
Key results
We recommended that DART move beyond using microtransit to simply "fill gaps" and instead incorporate it into a continuous feedback loop for system redesign.
Future efforts should include using predictive demand models to pool passengers more effectively and employing "nudging" strategies through rider apps to align demand with optimized fixed-route schedules.
More broadly, we suggested that agencies must balance data-driven insights with human expertise to account for the unique political and social nuances of urban planning.