
Case Study
Streetohome
Mapping hotspots of addiction in Vancouver to better plan recovery centres.
This project was conducted on behalf of the non-profit Streetohome Foundation to address British Columbia’s addiction epidemic by identifying optimal locations for new Recovery Community Centres (RCCs). Using open-source data and spatial modeling, we analysed the accessibility of addiction support services across Metro Vancouver. The goal was to provide a data-driven framework to help broker a comprehensive system response to homelessness and substance use.
The primary goals of the project were to:
Identify service gaps: Map exactly where addiction support is currently being catered for, and where significant gaps in accessibility exist.
Guide infrastructure placement: Provide evidence-based insights to determine whether new RCCs should be placed in areas of high current demand for addiction support or underserved areas of low supply.
Project goals
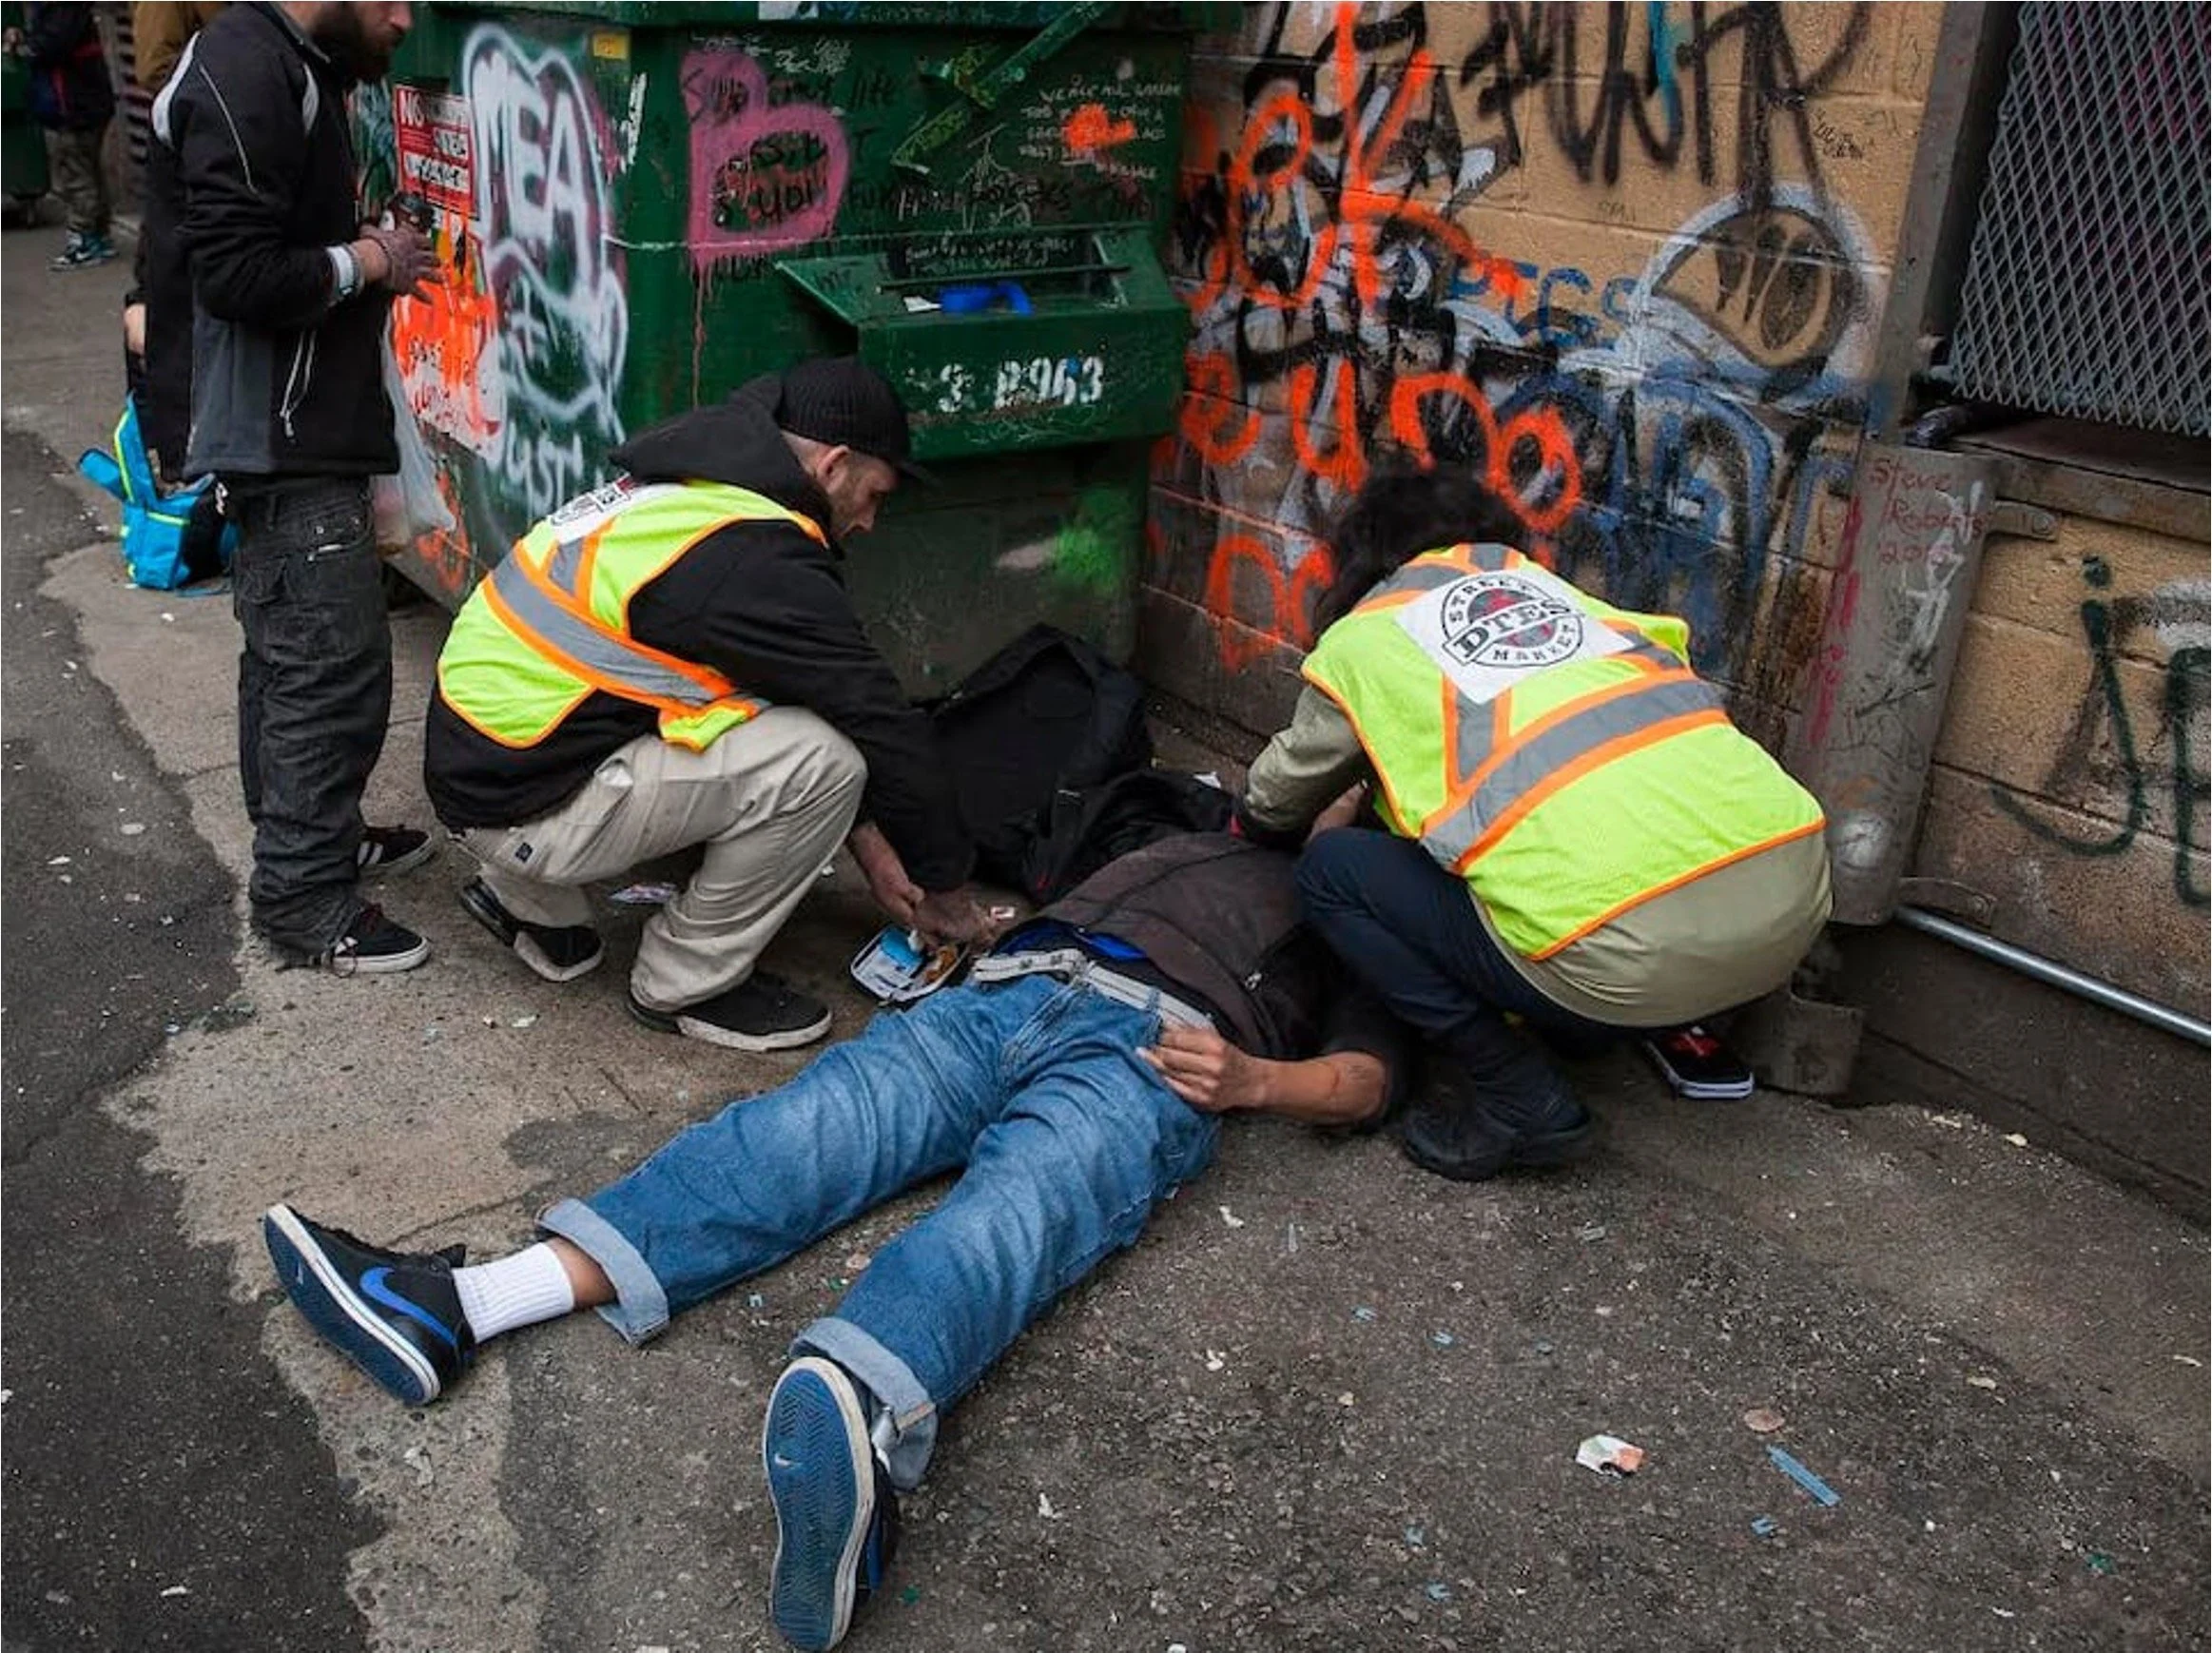
Since direct data on addiction and homelessness is often difficult to access, we used the locations of Alcoholics Anonymous (AA) meetings as a proxy for addiction support services. The analysis was based entirely on open-source data and methodologies, for easy replicability:
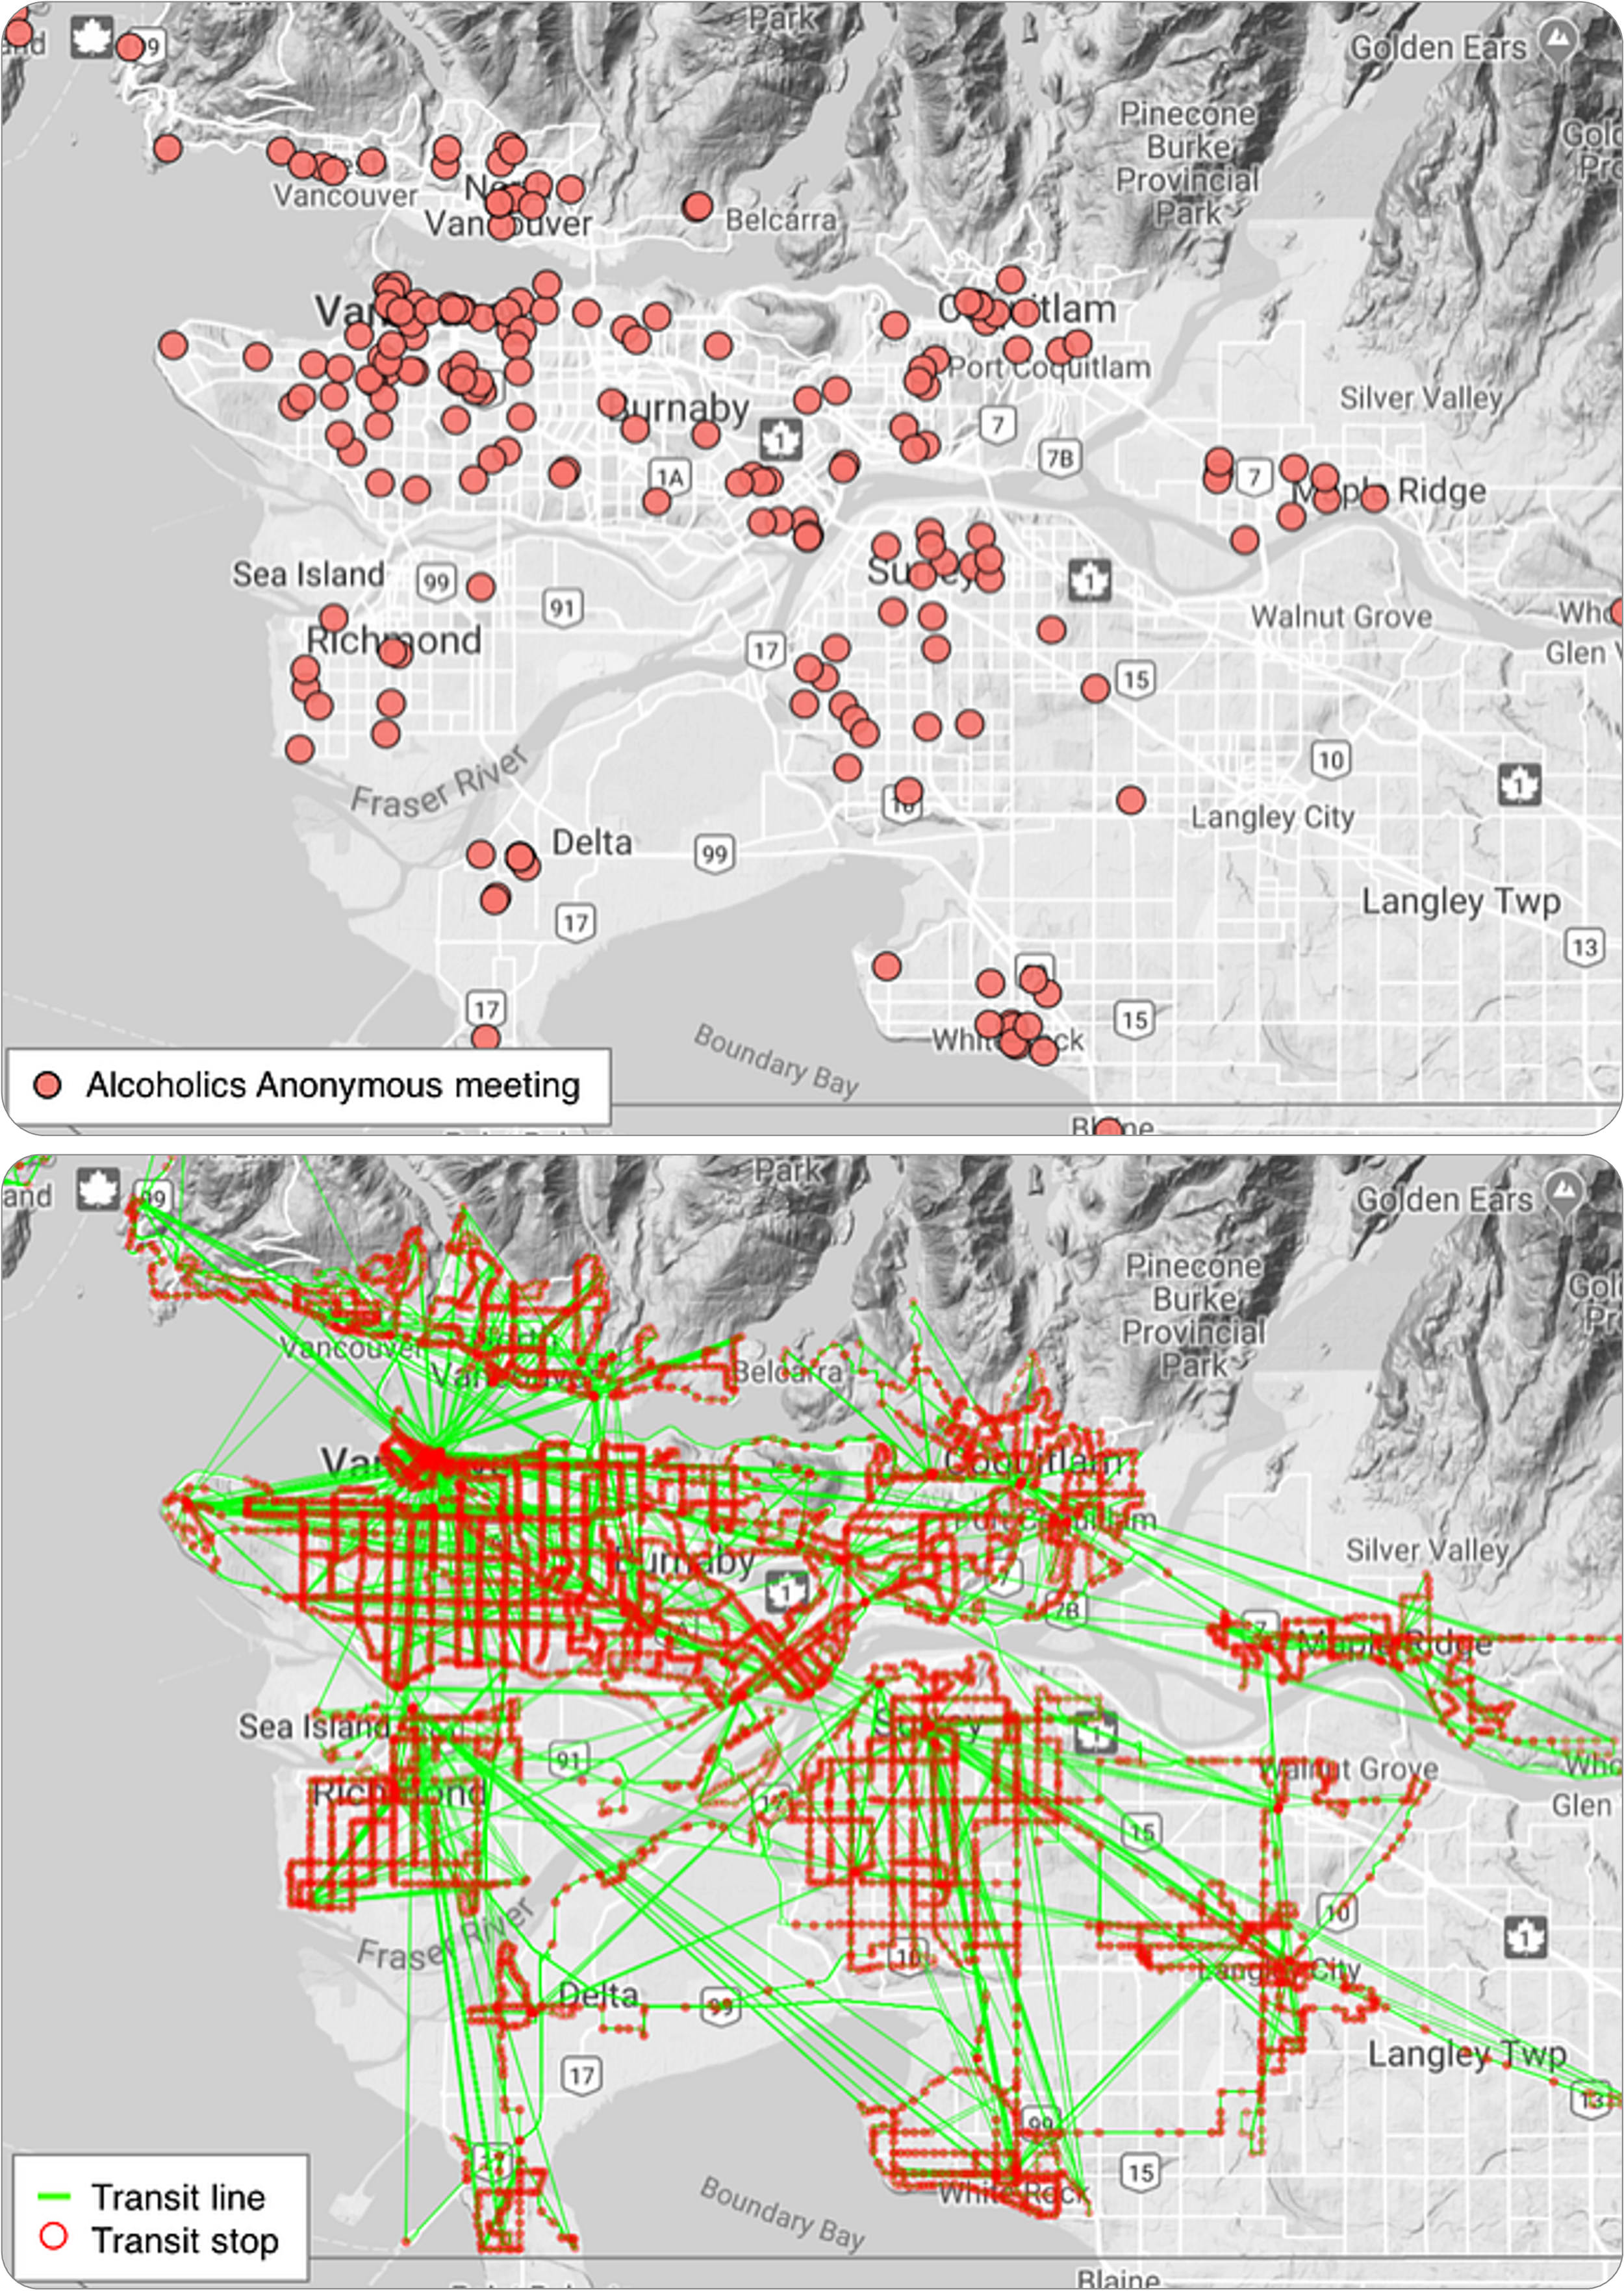
The locations of all AA meetings across an entire week were scraped directly from the AA Metro Vancouver website.
The layout of roads and sidewalks of the entire region were downloaded from OpenStreetMap, an open-source equivalent to Google Maps.
The timetables and routes of the public transit network were downloaded from Translink (the regional transit operator), in the General Transit Feed Specification (GTFS) format.
Shapefiles of the administrative boundaries of the region were acquired from MapIt.
Census population counts from 2018, downloaded at the Dissemination Area level (the highest resolution openly available) from Statistics Canada.
In order to simulate realistic journeys through the region, the Metro Vancouver region was divided into 1-km sized hexagons. A routing algorithm (described in full detail in this paper) was used to simulate the route between every hexagon’s centre point to every AA location in the region. This algorithm was run assuming transportation by (a) car only, and (b) public transit only.
Once the routing was complete, a ‘cumulative opportunity’ analysis was performed: put simply, we summed the total number of AA locations that could be reached within 30 minutes from every hexagon.
Approach
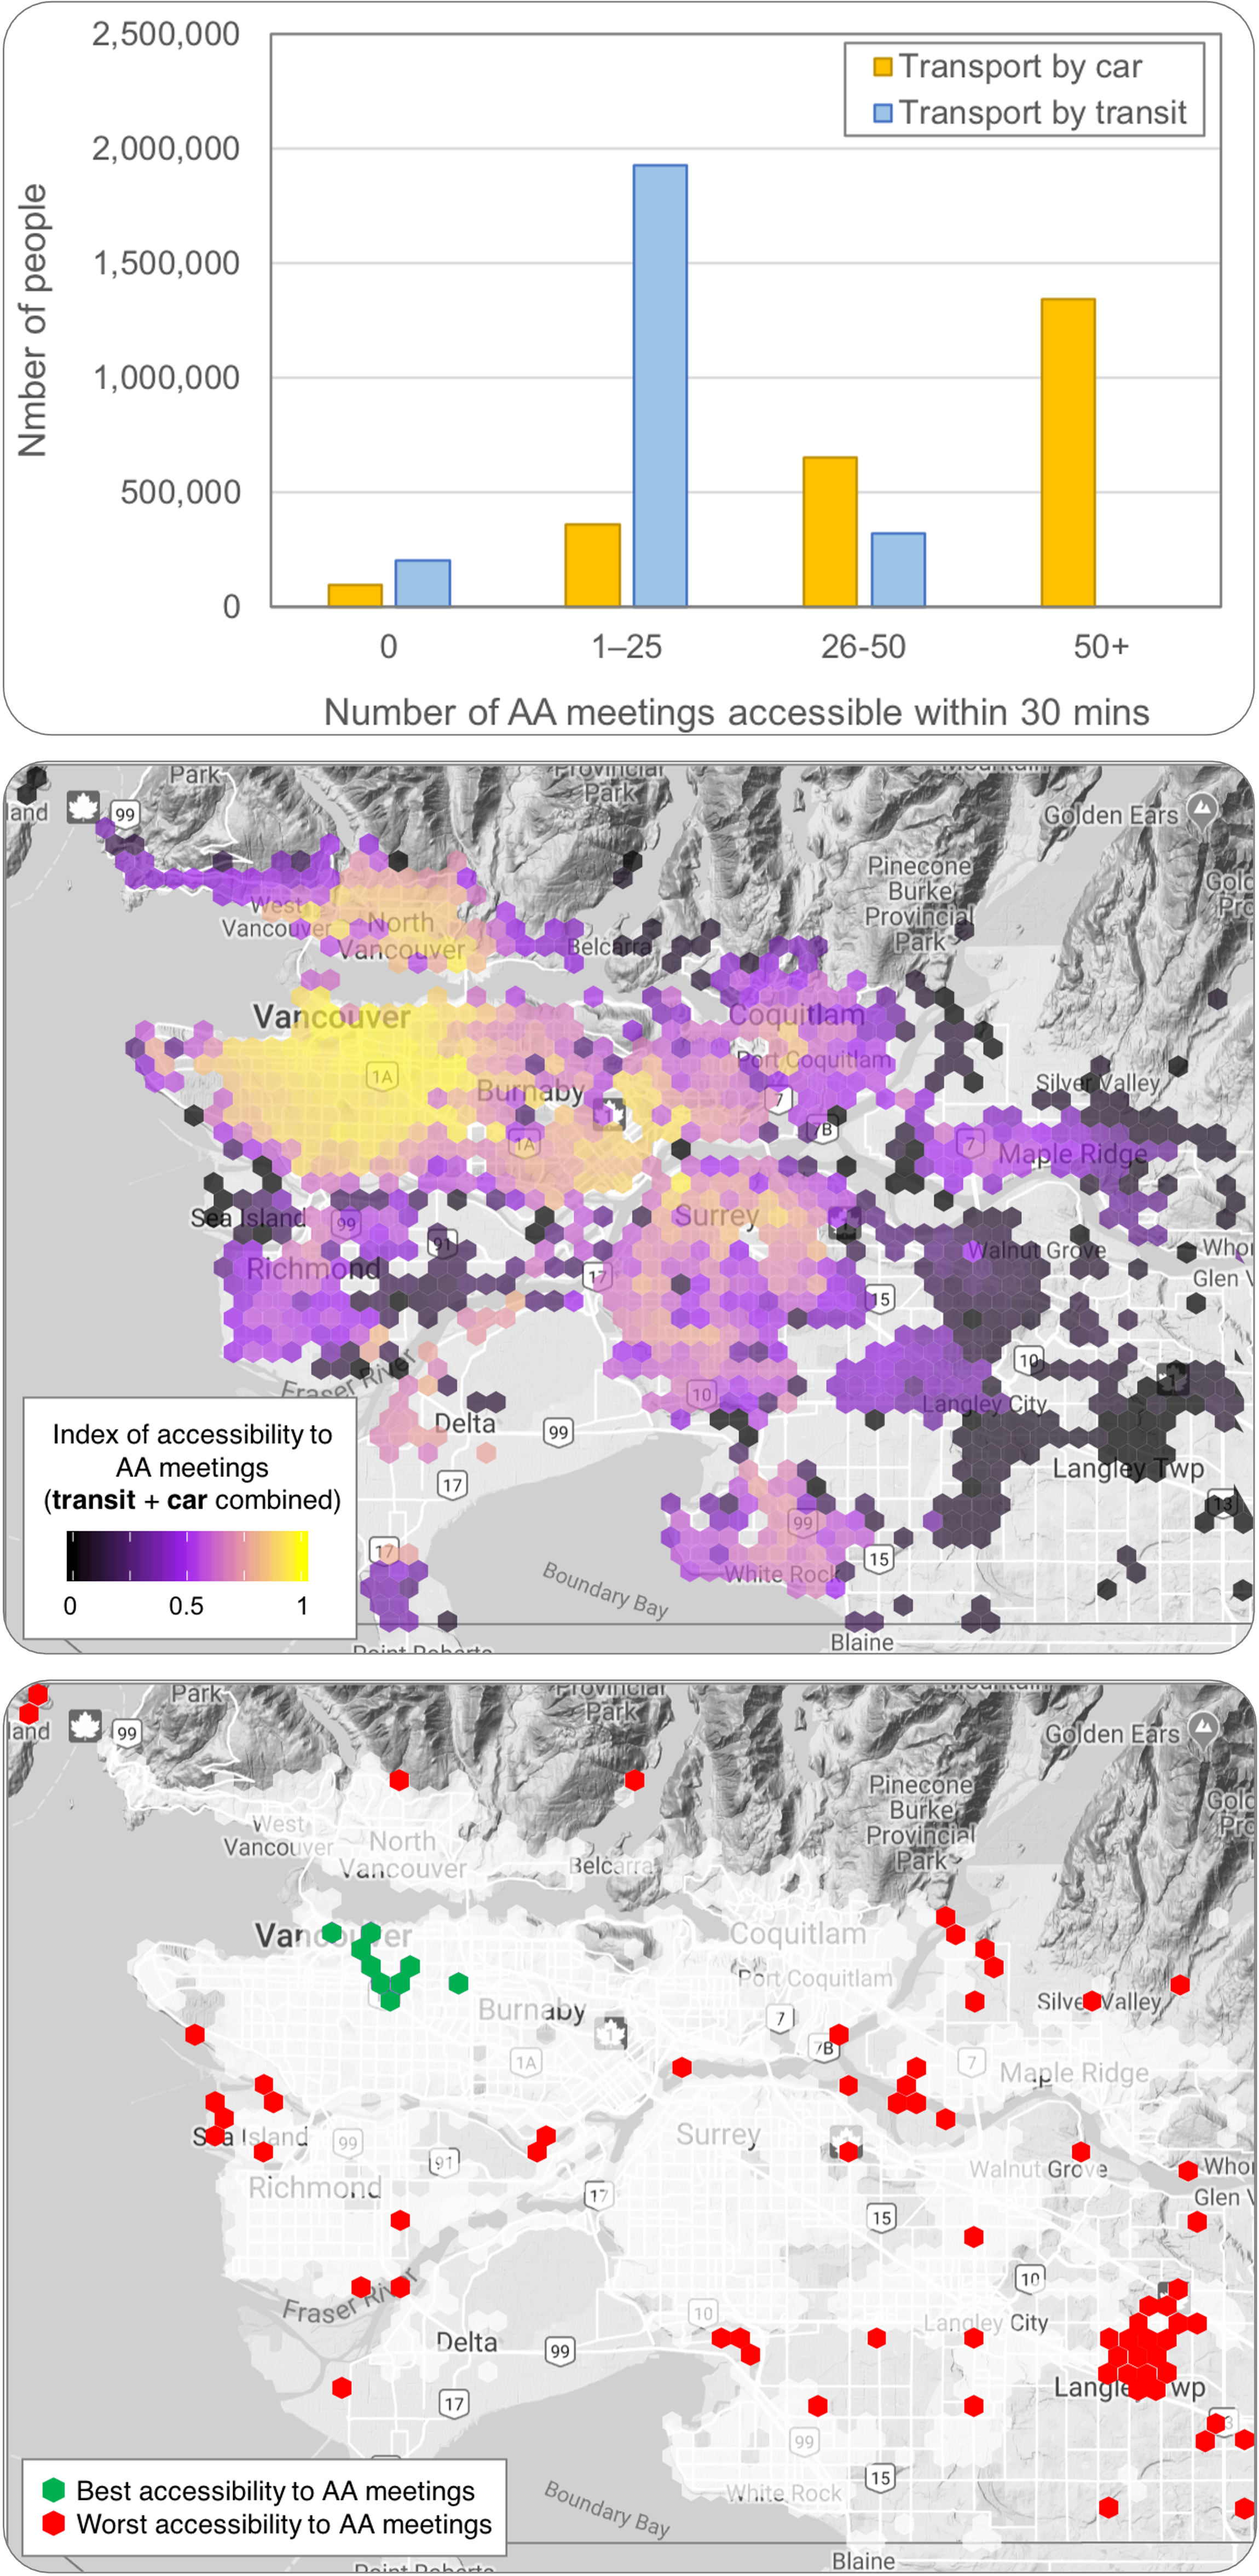
Underserved Populations: Approximately 79% of the population can reach fewer than 25 meetings via transit, and 200,000 people cannot reach a single meeting by transit within 30 minutes.
Transportation mode disparity: Over 1.3 million people (55% of the population) can access at least 50 AA meetings from their home by car. However, zero people can access that many meetings by public transit.
Weighting by accessibility: We produced a weighted accessibility index (prioritizing transit, as vulnerable populations rely on it more) to highlight the best and worst-served neighborhoods in the region. These are shown in the map on the left, with yellow showing high accessibility and purple/black showing low accessibility.
Hotspots and coldspots: The greatest supply of AA meetings — and possibly, by extension, the highest demand for them — is around East Vancouver (coloured in green), including the Downtown Eastside where the concentration of homelessness is highest. Conversely, there is a far higher diversity of locations throughout the region with zero access to a single AA meeting (coloured in red).
Supply vs. competition: Our analysis moved beyond simple meeting counts to account for "competition," recognizing that, like schools, recovery services have a limited capacity based on the surrounding population. the hexagons with the highest combined scores, and the hexagons with the lowest combined scores.
Key results
The findings serve as a strategic roadmap for Streetohome and local policymakers to decide between expanding existing recovery hubs or venturing into underserved "transit deserts." Our open-source methodology was designed to be transferable to other city regions facing similar public health challenges.
It’s worth noting the difficulties in interpreting these maps. Should an RCC be set up where accessibility to AA meetings is highest, presuming that a greater number of meetings equates to a greater level of addiction rates or ‘demand’? Or rather, should we target areas where accessibility is lowest, on the basis that there is an unacceptably low ‘supply’ of service? There is no right answer at this stage — more research is needed to identify potential users’ needs across Metro Vancouver.